
Hyper Software ne hamare business ko online ek nayi pehchan di. Website professional, fast aur SEO optimized hai. Website Design & Development ke liye best company.

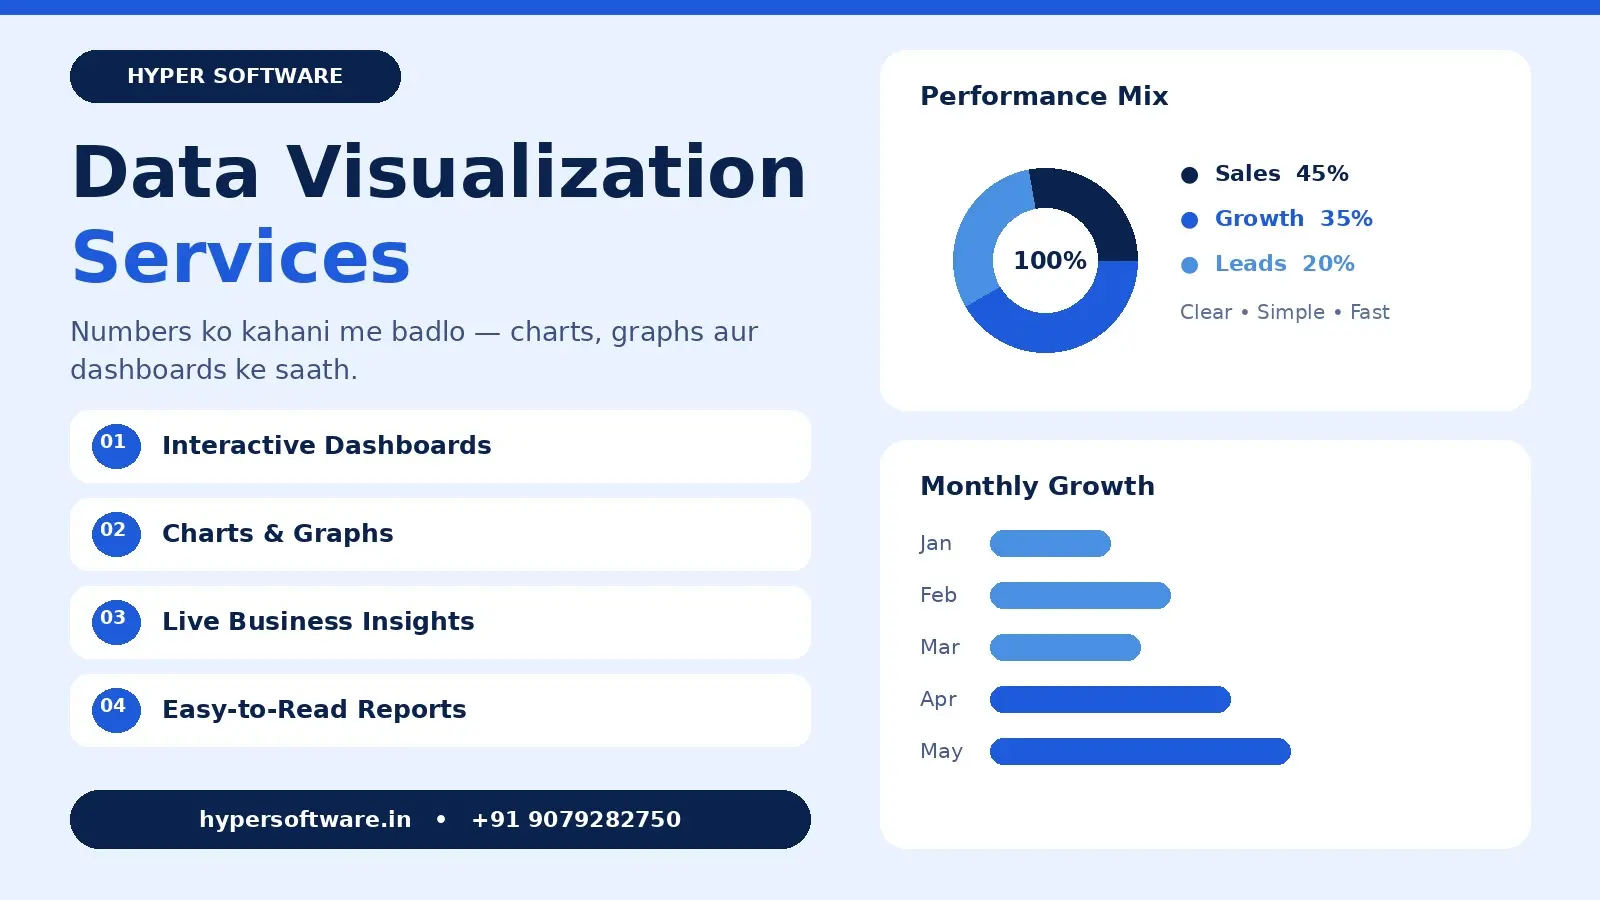
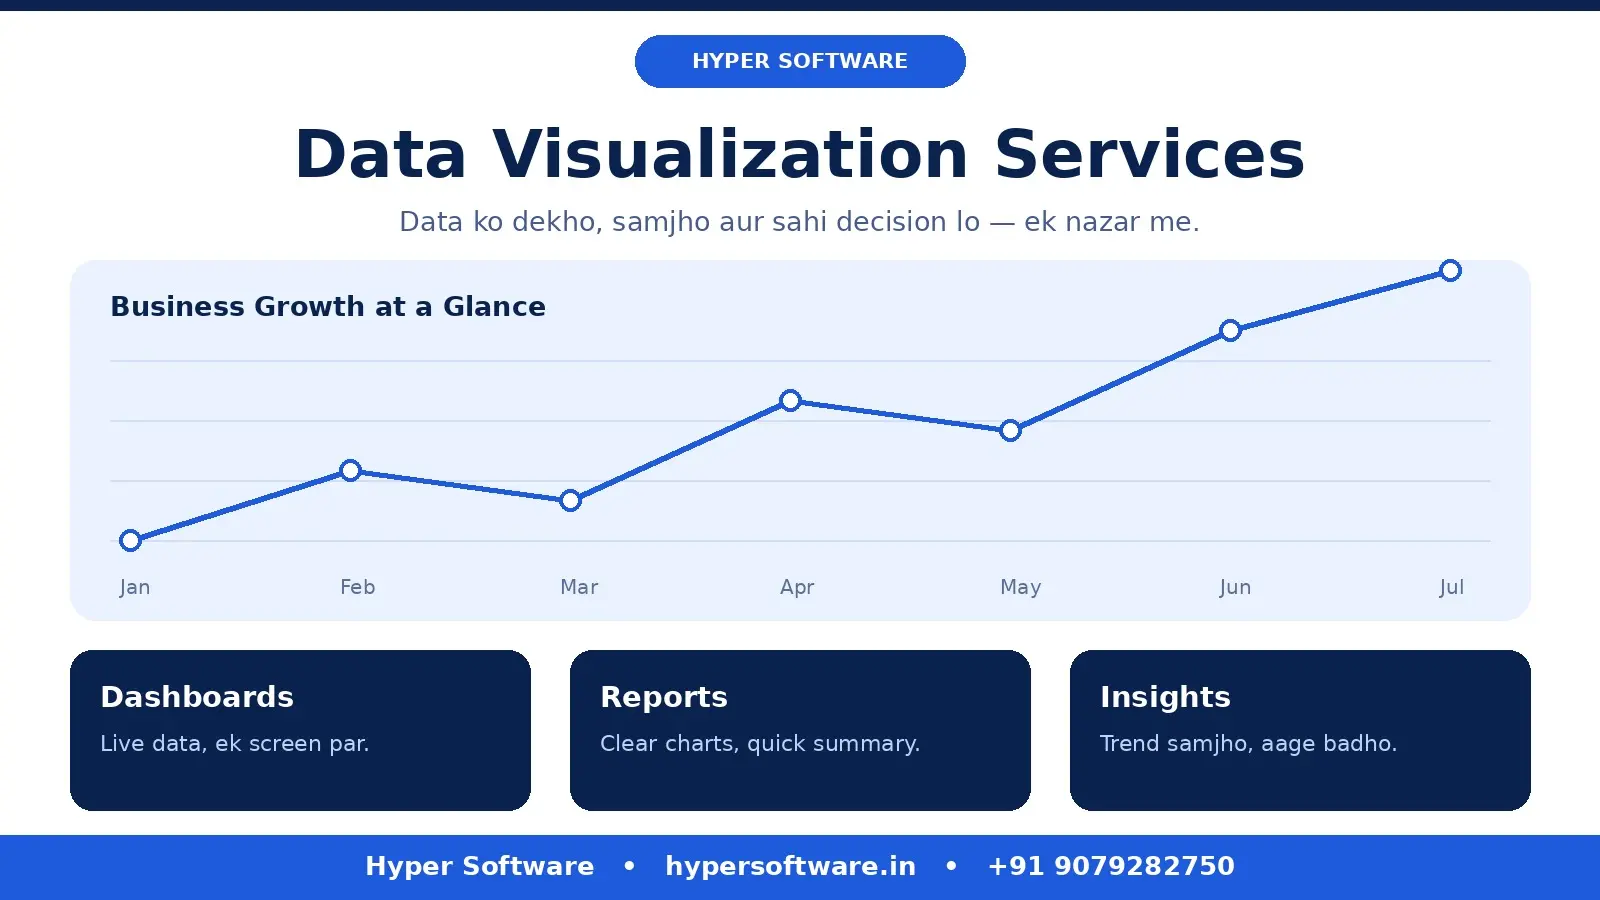
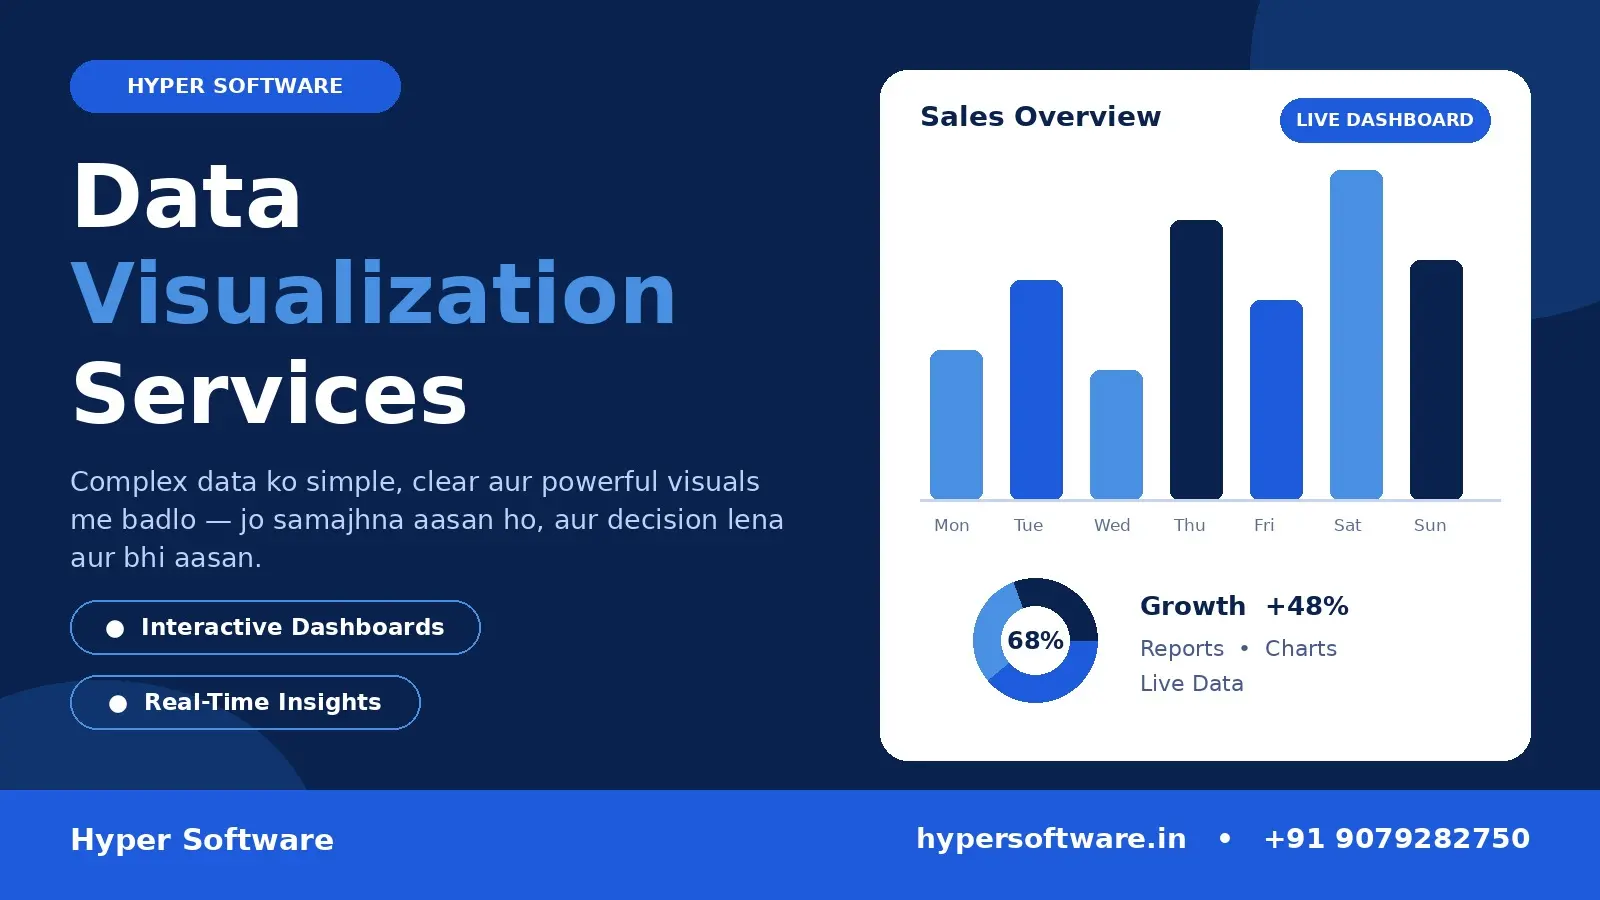
Data visualization services turn rows of numbers into dashboards that show, in seconds, what's going up, what's going down and what needs attention. Hyper Software designs and builds dashboards in Power BI, Looker Studio, Tableau and custom web apps, connected to live data your team can trust.
A good dashboard answers a question before anyone asks it.
Data visualization is showing data as charts, graphs and dashboards so patterns are easy to see. You get:
Get Free Consultation Within Minutes
| Option | Best for | Cost note |
|---|---|---|
| Power BI | Microsoft 365 companies, strong modelling | Per-user licences for sharing |
| Looker Studio | Google Ads, GA4, Sheets users | Free for most uses |
| Tableau | Advanced visual analysis | Higher licence cost |
| Custom web dashboard (React, Chart.js, ECharts) | Dashboards inside your product or portal | Build cost, no per-user fee |
Hyper Software ne hamare business ko online ek nayi pehchan di. Website professional, fast aur SEO optimized hai. Website Design & Development ke liye best company.

| Dashboard | Typical KPIs |
|---|---|
| Sales | Revenue, orders, average order value, target vs actual |
| Finance | Margin, receivables, expenses, cash flow |
| Marketing | Leads, cost per lead, conversion, ROAS |
| Operations | Stock levels, delivery time, returns |
| HR | Headcount, attendance, attrition |
| SaaS product | Active users, churn, MRR, feature use |
Not sure where to start? Call or WhatsApp Hyper Software on +91 9079282750 or email info@hypersoftware.in for a free first consultation about Data Visualization.
| Scope | Indicative cost |
|---|---|
| Single dashboard, 1 to 2 data sources | ₹20,000 to ₹60,000 (about US$240 to US$720) |
| Multi-page dashboard set, several sources | ₹60,000 to ₹2,00,000 |
| Custom web dashboard in your app | ₹80,000 to ₹3,00,000 |
BI tools make it easy to drag charts onto a page. The hard parts are a clean data model, correct definitions, fast loading and a design people understand.
| DIY dashboard | Expert-built dashboard | |
|---|---|---|
| Data model | Often flat and slow | Structured and fast |
| KPI definitions | Unclear | Agreed and documented |
| Design | Busy | Focused |
| Adoption | Low | Higher |
They design and build charts and dashboards that present business data clearly, usually with live data connections.
A single dashboard usually costs ₹20,000 to ₹60,000. Multi-source and custom web dashboards cost more.
Power BI for Microsoft users, Looker Studio for Google tools, Tableau for advanced analysis, or custom for in-app dashboards.
Yes. Dashboards can refresh on a schedule or near real time depending on the source.
Yes. We embed BI dashboards or build custom ones inside your product.
Yes. We design mobile layouts for key pages.
Yes. We set row-level access so each user sees only their data.
Yes. Clean, modelled data is the base of every dashboard we build.
A single dashboard takes 1 to 3 weeks. Larger sets take longer.
Yes. We review and redesign them for clarity and speed.
A distribution company's management meeting started every week with 30 minutes of arguing over whose numbers were right. We built a Power BI dashboard on one shared data model from their ERP and CRM, with clear definitions for sales, returns and margin. Meetings now start from the same screen, and the sales head reviews branch performance on his phone each morning.
Presenting data as charts and dashboards so it's easier to understand.
Power BI often suits Microsoft users on a budget; Tableau is strong for advanced visual analysis.
Yes, for most uses, with paid options for extra features.
A few key KPIs, clear charts, consistent colours and trustworthy data.
Yes, with scheduled refresh from connected data sources.
Have questions or need expert guidance? Our team is ready to help you with the right technology solutions for your business.